Introduction
Hello and welcome in this new tutorial on how to best use Pro.Lean™.
In this tutorial you will learn how to integrate Grafana in Pro.Lean™ software.
Procedure
Grafana server download
In order to use the dashboard designed for Grafana in a project
with the ProLean plugin, you must first of all download the Grafana
Server's runtime. This can be done by using this link:
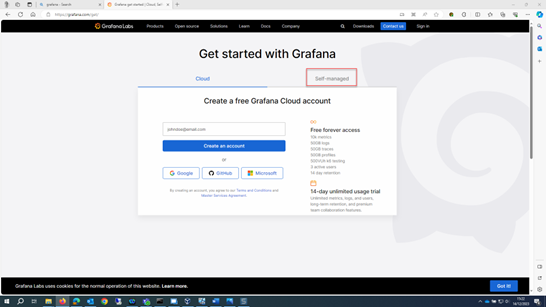
https://grafana.com/get/
The page below will open:
At this point:
- Click the Self managed tab.
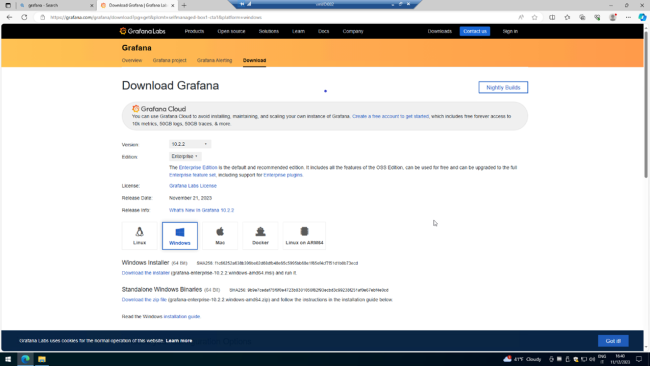
- Next select download of the first box on the top left (Grafana) which is the option for Windows.
- Click on Download the Installer option under the Windows Installer section to download the setup msi file.
In this window, you can opt to use the Windows Installer package (Download the installer), which will create the folders on the PC and also configure and run the service of the Grafana server, or the zip file containing the entire Grafana environment from which the server can be run manually once this file has been unzipped.
Grafana Installation
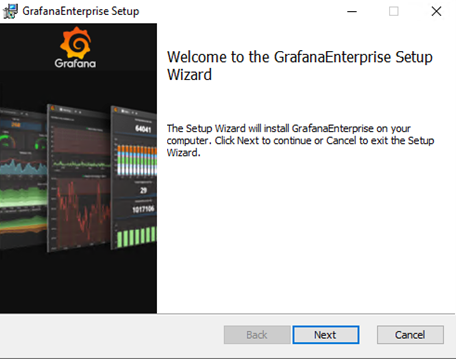
Once the Windows Installer has been downlaoded, start the installation
by doouble-clicking on the msi package.
After starting the installation procedure, the msi package proposes
a configuration wizard. From the first screen, click on the Next button
to proceed with the configuration.
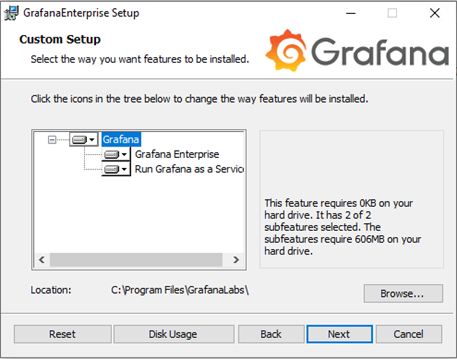
In the step below, you can select how to configure the setup, eg. which features to install, whether to run Grafana as a service, and its location.
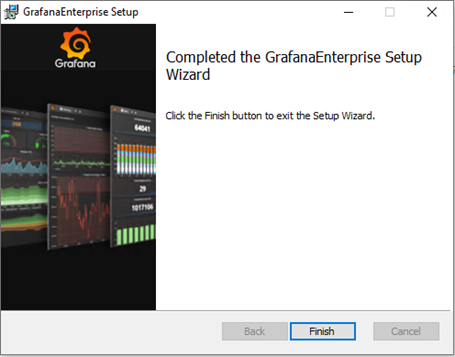
Once the installation procedure has terminated close the wizard clicking the Finish button.
Grafana Configuration
Let's configure Grafana so that we can login as an anonymous user. To do this:
- Look for the defaults.ini file in the C:\Program Files\GrafanaLabs\grafana\conf folder. Once found, open the defaults.ini file using a text editor (eg. Notepad++).
- Change the value enabled = false to enabled = true in the setting [auth_anonymous].
- Restart the Grafana service from the Task Manager to make the Grafana server take on the new settings.
Finally, make sure that the TCP/IP port 3000 is open on the firewall.
Data Source configuration and import of the Pro.Lean™ Dashboard
At this point, let's complete Pro.Lean configuration after making sure that Grafana server service is correctly started.
Login
In order to configure Grafana, you need to open its web interface.
To open it, use the following link in any web browser address bar
http://localhost:3000
Once loaded, the Grafana configuration interface will open and it will
prompt for login credentials.
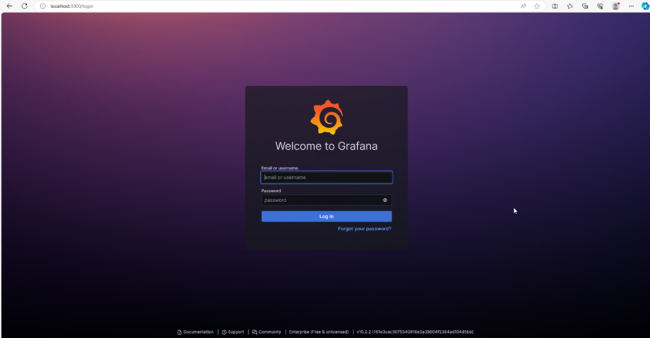
Initially, default credentials may be used. They are:
- Email or username: admin
- Password: admin
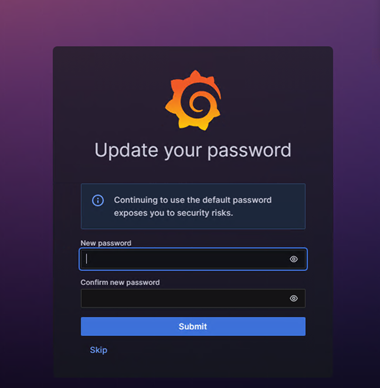
The next step is to change the password. If you do not want to change password to the admin user, you can continue by simply clicking on Skip.
Data Source
One of the steps required to configure Grafana dashboard for the
Pro.Lean plugin is the creation of a Data Source.
To perform what is described, after correctly authenticating yourself
in Grafana:
- Click on Data Sources button and choose Microsoft SQL Server from the data source list.
- Configure the data source to connect Grafana to the Microsoft SQL Server database of the Pro.Lean project by entering the SQL Server instance name, the Pro.Lean project database and the authentication type.
- Save and test the configuration.
Dashboard creation
The configuration of the standard Pro.Lean dashboard is contained in a file that is installed with the plugin, so simply follow the steps to import the dashboard from the .json file:
- Click on the Dashboard button to start creating one.
- Once the dashboard creation menu has appeared, click on the Import Dashboard button to import one.
- In the window taht has just appeared, click on the Upload dashboard JSON file to open OS Windows Explorer dialog.
- Once the Windows Explorer dialog has appeared, look for the file OEE Analysis.json inside the folder C:\Program Files\Progea\Movicon.NExT 4.X\LeanResources\Grafana. Select it and click Open to continue with the import.
- Select the previously created data source and click on the Import button to import the dashboard and finish the configuration.
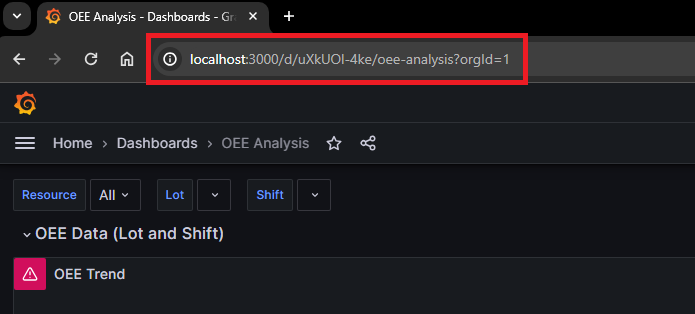
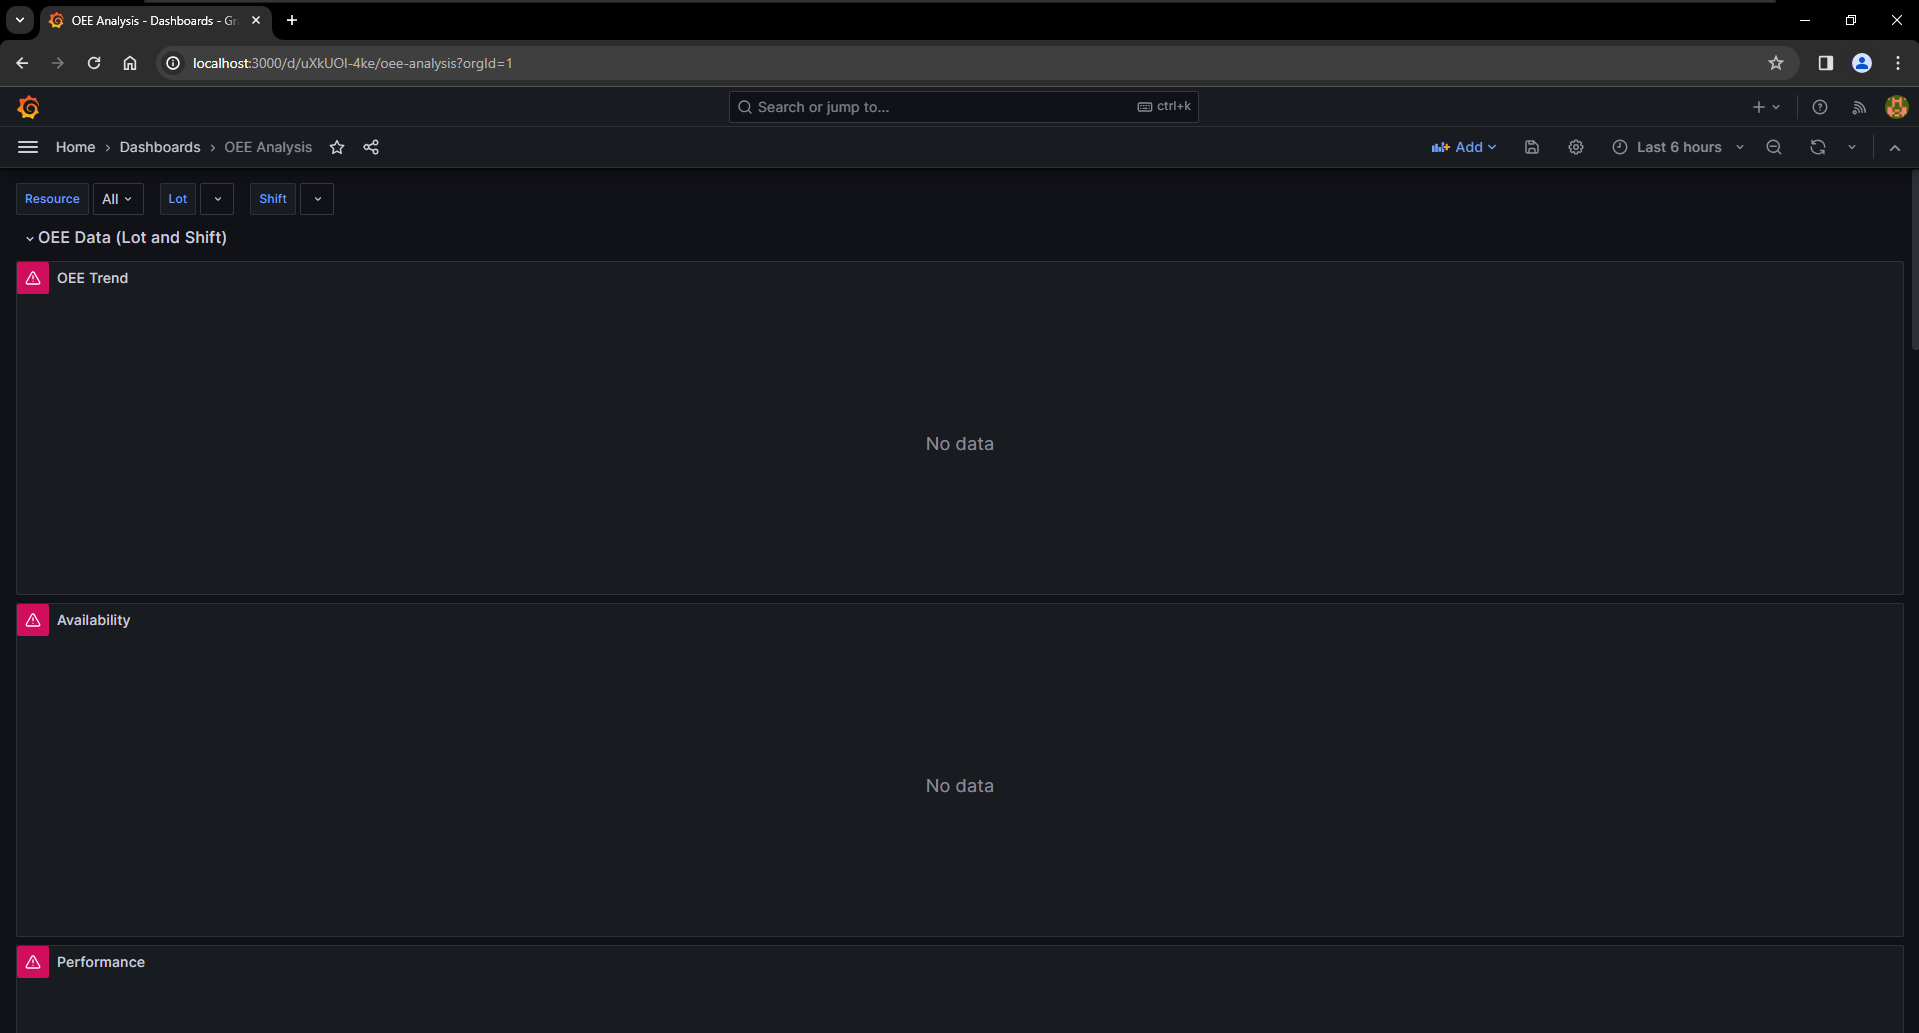
The newly imported dashboard will look as follows.
The link shown in the address bar must be used in the last step of the Pro.Lean configuation wizard.