In order to make any changes to a variable, simply click the right side of the displayed value and then enter a new one. As an alternative, after having selected the line with the variable, press the F3 key down to enable value editing.
Movicon Help on Line - Rel. 11.7.1302
The Movicon "Watch" window is used to display the project's status, logic debugging and forcing variables during the project Runtime phase. This window is only available when the project's Runtime is launched directly from the development session.
When running a project from the design environment, you will be able to view information on items contained within a symbol by using the CTRL key upon pressing the mouse key. Only information on the item pointed to by the mouse cursor will be loaded in the watch window and not on the symbol containing it.
This will allow you, for example, to view the IL logic of one of the symbol's items only and not the IL logic of the symbol container itself.
The "Watch" window is composed of different groups of information:
The Watch group is composed of different TABs. The 'Project' TAB contains information on the project's general characteristics, such as the number of variables in use, the number of active screens, the number of connected Clients, etc. The other TABs, called 'Watch 1', 'Watch 2'. etc., allow one or more variables to be selected so that they can be monitored or changed.
|
In order to make any changes to a variable, simply click the right side of the displayed value and then enter a new one. As an alternative, after having selected the line with the variable, press the F3 key down to enable value editing. |
When clicking on the command to select variables to insert in the window, the Movicon Tag Browser window will open. This window can be used to select Variables from the project or any child project to view in the watch window. However, this window cannot be used to insert new variables, basic script expressions or dynamic links, or to modify variable properties. In addition, variable names cannot be right clicked.
The Project Statistics group documents the use of the resources retrieved by the system by representing them on a table correlated with pie charts.
|
By using the buttons from the menu bar, you will be able to refresh data, select pie or histogram data displays, and reset statistical data using the "Cancel" button. The "Cancel" button can be used to zero the project's statistical data recorded up to that moment to then restart from scratch. |
The Locals group displays information on objects that are on screen. When clicking on an object on the screen, this window will change its contents to display the information regarding that object.
When double-clicking on an object, which contains Basic Script code, in this window, its Basic Script code debug window will open. If the object does not contain code, a beep will sound and no window will open.
The IL General Logic group allows the debugging of the IL Logic resource associated to the project to be run.
The IL Local Logic group is used to debug the selected IL Logic associated to the component or screen to be run.
The Script group lists the Basic Script resources that have been loaded in memory along with some useful information, such as status (running or stopped) and total execution time of the last run or the run in progress. When double-clicking on the name of a listed Basic Script, the debug window of that basic script resource will open.
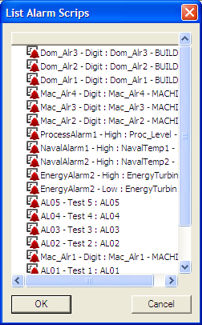
This window is opened by using the "Alarm Script Debugger..." command from the "RunTime Bar". This window lists all the alarms managed in the project. When selecting one of these alarms, the debug window of the Basic Script code inserted in the alarm's threshold will open.