Movicon Help on Line - Rel. 11.7.1302
The Report Designer is an extremely powerful tool that has been integrated in Movicon to provide users the possibility to automatically create reports relating to the Movicon databases without needing to purchase any supplementary software packs. The Report Designer Libraries are installed with Movicon for free and you do not need to enable any license options in order to use them.
The steps to create a basic report are described below.
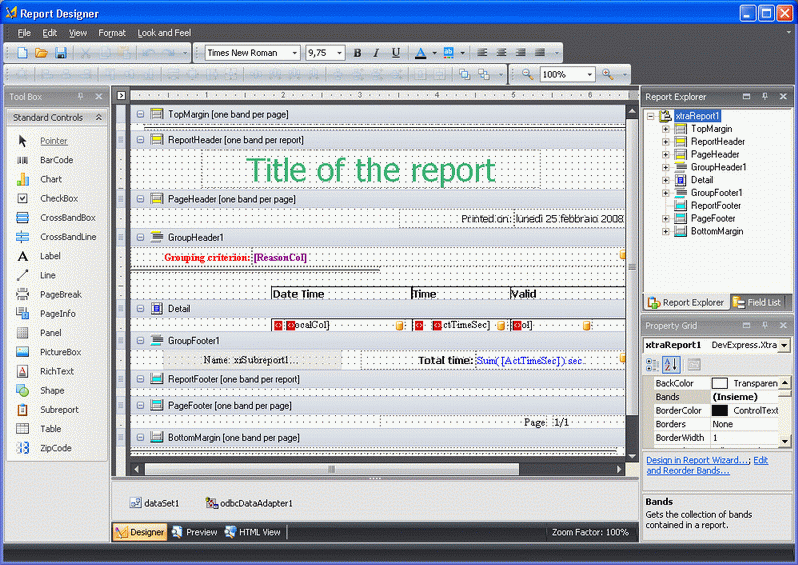
The Report Designer can be called through "Edit Report File" command found in the Data Logger or recipe properties of the "Historical Log Window" or "TraceDB Window". When called, the Report Designer will open in edit mode:
The Report Designer opens showing its "Tool Box" on the left, and the "Report Explorer", "Field List" and "Grid Property" on the right. The report Layout is in the centre.
By means of using the Movicon commands, the report will open with the database connection already configured with the original object's data table fields listed in the "Field List" for reference (DataLogger/Recipe table variable TraceDB or Historical Log).
The report is built with "Band" objects, which can be inserted by using the "Insert Band" command that is accessible with a right click on the report layout area. The Bands are:
Top Margin: one per page only and represents the top limit of the report page.
Report Header: one per report only and it is the first thing printed on the first report page only.
Page Header: this is printed at the top of every page.
Group Header: you can use more than one group header per report to represent the beginning of a data group.
Detail: contains the data to be shown.
Group Footer: this closes a data group and always in correspondence to a Group Header.
Report Footer: this is printed at the end of the report on the last page.
Page Footer: this loses each report page.
Bottom Margin: one only per page and it represents the report page's bottom limit.
You will only need to use the Detail Band to build a basic report. The fields you wish to display can be dragged from the "Field List". When the report is executed, these fields will show with all the records exiting in the table.
Filters
To filter data, you can select and use the xtraReport object's Grid "FilterString" property. This property must contain the expression criteria (WHERE (e.g. [col] > 0, where "col" is the name of a data table column).
Groups
You will need to insert a Group Header Band and then use the "GroupFields" property to set a second field to group data. You can also define the data order by using this property.
Data Summary
The report can perform summaries (totals, counts, and averages) on data groups. This is done by inserting a "Label" band linked to a field from the Field List. The "Label's" "Summary" property allows you to set the summary type you wish to create by using a dialog window with the following:
Bound field: name of field in which operation is to be executed
Summary function: operation type to be executed
Format string: format type for results where you can add measure units as text
Ignore NULL values: specifies whether or not to ignore NULL field value records
Summary Running: defines the environment in which to execute the operation. Obtains these values:
None = no calculation
Group = executed for all group members. This value resets at the beginning of the next group
Page = executed for the values presented on one page
Report = executed for all the values in the report