The Trend is a powerful tool which can be used to display data recorded by Data Loggers and at the same time acts as a data recorder to record data in the standard .CSV format.
Movicon Help on Line - Rel. 11.7.1302
The Trends display curves that represent the behaviour of variables to analyse data logged by recording engines.
The Trends are the most powerful tool you can use to display and analyse the data contents of Movicon variables that have been logged on database files.
The Trends, in addition to their own intrinsic features, have all functional features of the Movicon drawings and vectorial symbols, including the Power Template© technology.
The Trend object is a tool which offers different function modes. It can be used to display and log data independently as well as connect to database objects inserted in the Data Logger to represent recorded data according to date and time or on event.
The Trend belongs to the Movicon "Trend - Charts - Data Analysis" category in the "Toolbox Window" and can be placed on screen by using the drag&drop techniques.
|
|
The Trend is a powerful tool which can be used to display data recorded by Data Loggers and at the same time acts as a data recorder to record data in the standard .CSV format. |
The trend has been designed to guarantee the maximum of flexibility in managing graphical recorded data displays. This object function in two ways: it can be used to represent recorded data graphically and to record data.
Normally the Trend is used to graphically represent data recorded by the Data Loggers which act as the Trend's recording engines. However, the Trend can actually record associated variable data in ".CSV" text format and retrieve recorded value data using the data import functions. When the trend is kept active on a screen, which has been enabled with the 'Keep always in Memory' option, it will function as a recording engine remaining constantly in use.
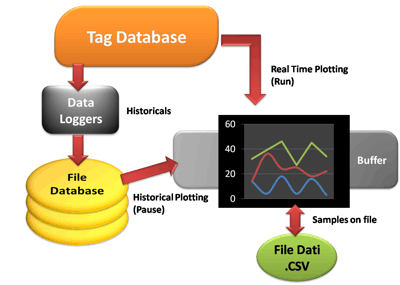
A flowchart showing how Trends work.
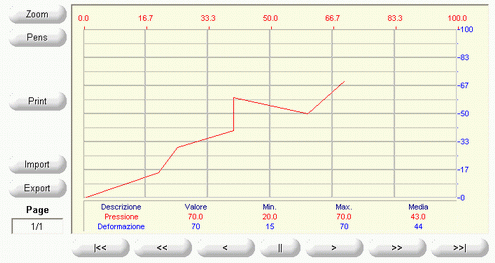
The Movicon Trends are used to display and record the plant's variables' behaviour. The Trends are most efficient tool for logging, printing and graphically analysing the behaviour of variables that constitute the heart of the plant (usually analogic variables), such as temperatures, pressures, levels, load cells, chemical measures or any other physical value converted into an electrical signals.
Movicon also allows you to use different modes to manage variable representations on Trend charts with curves.
Time Based Trends
These types of trends are based on the Movicon vectorial drawings with advanced features for managing data representations and recording engines, as well as representing ations of database values recorded by Data Loggers.
This is an example of a template containing a symbol composed of a Trend object and other correlated button objects.
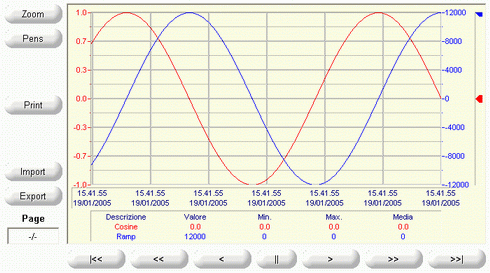
X/Y Trends
The trend can also be used to plot variable behaviour using a curve shown on an X/Y chart, where the X axis is no longer associated to time but to the first pen on the list and the Y axis is associated to the second pen on the list. This is done in such a way that the coordinates of the X and Y points are determined by the associated variables, and a line is generated by the trend for each sampling to connect the previous XY point to the current one. Several XY curves can be displayed in one trend to match the pairs of pens inserted.