Movicon Help on Line - Rel. 11.7.1301
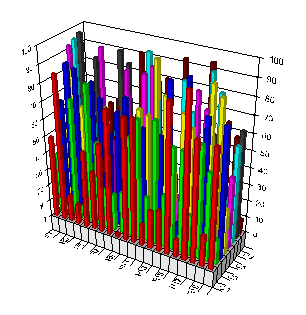
Movicon has integrated a very powerful tool to represent project variables on two-dimensional and three-dimensional charts.
Movicon has object windows which can be configured as pleased to create different kinds of charts placed in relation to the Movicon variables. These objects can be added to any Movicon screen by using the "chart" command from the "Trend-Charts-Analisi Dati" ToolBox.
The charts are built with objects that have different style features from other Movicon objects that we have seen so far, that allow you to create even more sophisticated and powerful configurations.

|
Charts use "Array" type variables. Therefore, you will need to carefully read the tips on their use in the charts. |
A Chart object can represent a series of historical curves to represent data retrieved from a Data Logger, or dynamic curves which are data retrieved from a array of data. The curves which represent historical values retrieved from a Data Logger, must not be set with variables and they must have the same name as that of the Data Logger column to be represented.
|
For further information on charts and their configurations, please refer to the "First Impression 5.0 On-Line documentation" (VCFI5.HLP) online guide, available in the Movicon's installation folder. |
|
The "Chart" object cannot be used in screens opened in separate threads ("Spawn Thread Execution" screen background property). Otherwise, the "chart" object will not appear on screen and the following error message will display in the output window:
Failed to create chart. Make sure the object isn't inside a synoptic with the separate thread option
|